(click for a larger view)
Sunday, August 22, 2010
Inflation Adjusted Average Gold prices
Inflation Adjusted Annual Average Gold prices in September 2009 Dollars.
That's $38,211 in circulation for every ounce of gold in reserve! Of course, it's even higher nowadays. The printing presses are cranking faster than ever in 2010. Only now, it's much harder to know how big the actual money supply has gotten as the number was so embarrassing that the Fed stopped to publish the “M3" measure in 2006.
Source: inflationdata.com
From 1880-1914 the U.S. dollar official gold price was $20.67 per ounce and the U.K. official gold price was £ 4.24 per ounce. By 1914 most countries in the world were on a Gold standard. This Gold exchange rate was maintained by a complex system of transferring Gold from New York to London. Creating a system of checks and balances that should have prevented the onset of inflation.
This worked fairly well until other countries began abandoning their Gold standard to finance the First World War. The U. S. entered the war late and was able to maintain its gold standard.
See that in the graph the nominal price of Gold is flat but the inflation adjusted price is not. If Gold perfectly hedged inflation the inflation adjusted price of gold would overlap the nominal price.
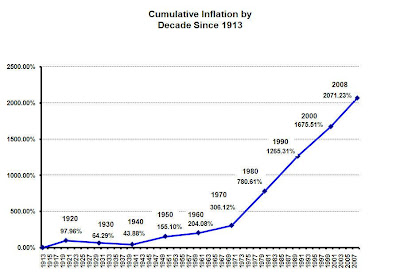
In the figure 4 "Cumulative Inflation by decade" from 1913 through 1920 inflation (as measured by the CPI) had increased by almost 98% (in other words in 7 years prices had almost doubled) but the price of Gold remained flat (by Government decree).
Then, over the next 10 years deflation set in as the roaring 20's unfolded as the US economy boomed and Europe suffered the after-effects of WWI. Finally, in 1929 the system could not stand the internal stresses and the stock market crashed ushering in the Great depression.
In 1933, President Franklin Roosevelt realized that the U.S. could not maintain the pretense that Gold was still worth only $20.67 per ounce (because at that price foreign government would have bought all the U.S. gold). So he perpetrated one of the greatest frauds ever on the American public. He forced U.S. citizens to sell their Gold at the official price of $20.67 and once he had collected all the Gold into government coffers, he adjusted the price to its real price of $35 per Troy ounce. Thus the government made a handsome 69.33% profit in a few months (equivalent to a 69% tax on Gold owners).
This effectively, increased the money supply and "legitimized" the inflation that had silently been occurring behind the scenes as prices increased but gold values did not. In hindsight, this increase in the money supply may have been the key factor in the emergence from the Depression.
Notice that in 1930 inflation since 1913 was up about 64% ... is it any coincidence that the Federal Reserve raised the Gold price 69%? No! that one time adjustment just brought it in line with inflation. But that didn't solve the problem permanently. By 1970 inflation was up 306% and gold was still officially $35 an ounce. Once again the price of gold needed adjusting.
Although U.S. citizens could not own gold, foreign governments could continue to present their foreign exchange tickets at the "gold window" and the U.S. was obligated to pay up in Gold.
So in 1971 President Nixon ended the US gold standard. At that point the price of gold bullion was allowed to float freely and find its own level.
This time rather than take all the Gold from the people (since they had none) the Government raised money by allowing the people to buy Gold back at the new higher free market prices.
Government gold sales had a tempering effect on gold prices for a while as the government liquidated its excess gold bullion. But by the late 1970's the government had stopped its gold sales and the price took off.
Many felt that this rise was in response to inflation. From the peak in1980 the inflation rate declined but cumulative inflation climbed steadily upward. But rather than keeping up with inflation the price of Gold fell from the peak of $850 per ounce down to under $300 in 2001.But in inflation adjusted dollars the scene is even worse. The 1980 peak in 2009 inflation adjusted dollars (figure 6) was over $2100 and it fell to under $346 losing a whopping 84% of its value!
So How High did gold really go?
In today's dollars, 1975 gold at $196 is more like $700 in the current market. And 1980 gold, the peak year at the historical price of $850, would now be closer to $2,189.
So if America has 8,180 tons, nearly 261.7 million ounces of gold in reserve, how many dollars does that buy? By 1980, for every ounce of gold in America, the financial system carried $6,966 in cash. That's $1.8 trillion total. But by the end of 2005, the total real money supply shot to over $10 trillion (see figure 2).
Corn and Oat
+40,7% in just more than one month!
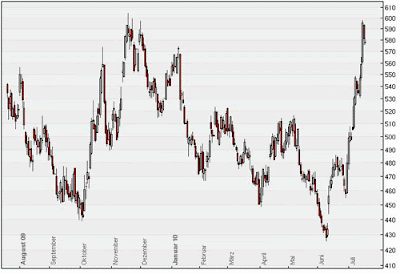
Last June 9, the corn reached 4,25 $ the bushel on the CBOT, and went to 5,98$/bu on July 15.
Analyst didn't forecast an increase in corn price, except if there is a climatic disaster! :-)
The largest world corn producers of the northern hemisphere are suffering
Canada, too much rain! A fifth of its production should be decimated.
In Western Europe, the drought threaten. In France (estimates of production with a fall of 3,5%) same thing with Germany.
In Russia, already 20% of the production (nine million hectares) are destroyed. Because of the drought. However Russia is just the fourth world corn exporter...
(As for Kazakhstan, because of the dry weather, it is a third of the production which is likely to be destroyed.
And the Ukrainian, too much rain, impossible to collect the corn.)
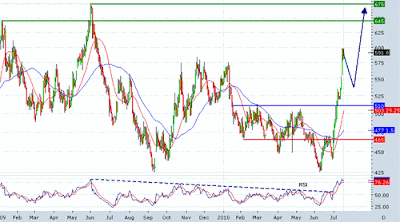
With a high RSI (76, overbought), a return under the 550c/bu is possible, with a support at 510. (for long that this support remain untouched we are in a bullish trend)
▪ the objectives are 645/675. Indeed, these levels are the highest reached last year.
▪ an alternative scenario: if the 510 support did not hold, corn will go down to 465, its next support.
So there is a potential of short-term rise, but remain careful about mid-term, stocks of corn are full and this is not sure that the corn market will be affected by the drought this year.
On the other hand, for the long run, corn remain definitively bull (Decrease in production, drought, increase of the world population...).
But what about Oat?
--> a high potential of grow
+40% in just one week! From June 9 to June 15 Oat increased by +40%.
Why?
Because of Russia's worst drought in 50 years. Russia is the biggest producer of oat in the world (20%).
Oat consolidates to its 275 support, before it goes up again.
Copper
Copper:
From the crash of the 2008 autumn and to its highest in last April, copper regained 182%!
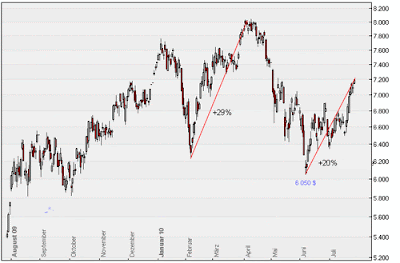
And Since the mini-crash of the markets in last May/June, it rebounded by 20%.
The offer is insufficient, BHP records Q2 2010 a fall of 5% of its production of copper over one year. And expects to see lowering its production by 5 to 10% over the next 12 months!
In the same time, the demand increases.
According to the ICSG (International Copper Group Study), the copper world demand over one year grew by 5,8% in April, whereas the offer only follows to the constant rate of 5,5%.
And China has not indexed its copper stocks, so we have to scan the volumes of copper which it imports.
In the Short Run: copper will remain strongly correlated to the equity market. And thus with the evolution of the world economic growth.
Indicators for the short run: the increase of the BDI, a decrease of LME and Shanghai stocks.
Any decrease under the 6 000 $/6 100 $ the tonne will be a good opportunity to invest in copper.
A prediction from Credit Suisse analyst Michael Shillaker, of $10,000 a tonne ($4.54/lb) in 2012.
Indeed copper has already touched close to $9,000 a tonne back in the heady days of 2008 before the bottom fell out of the market... (It suggests a big rise in mining company share prices over the next two years, Micahel is looking for around a 30% increase overall by the year end and as much as 100% or more for some stocks over the next two to three years.)
And always keep in mind that there is no doubt that when China will restart its massive copper consumption copper will be able to reach its highest. (if there is no double dip W)
Wednesday, August 11, 2010
FLOORED trailer
A world that's more riot than profession, the trading floors of Chicago are a place where gambling your family's mortgage is all in a day's work. Floored offers a unique window to this lesser-known world of finance. These men may not have degrees, but they've got guts, and penchant for excess that solicits simultaneous feelings of revulsion and admiration. But like many aspects of our economy, technology is changing the way these traders do business, and these eccentric pit denizens aren't the type to take kindly to new tricks.
Rare earth metals war
Candium, yttrium and the lanthanides, it tell you nothing?
The emergence of a mining sector with high potential investment opportunities:
Strategic and irreplaceable.
Without rare earth metals, no hybrid cars, no iPhone, no Ipad, no LCD or Plasma screen, no solar technology, no lamps with low consumption LED. No national defense either (they are essential in the armament) and no effective oil refining.
Moreover 25% of the future new technologies will need the rare earth metals.
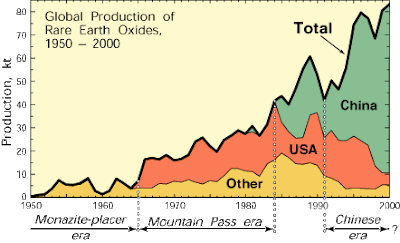
The rare earths are between the hands of Beijing.
China produces 95% of the world production of the highly strategic and irreplaceable rare earth metals.
China always exported its rare earth metals. But today, China wants to keep them for its technological future and thus reduces its exports.
Over the last seven years, China has reduced the amount of rare earths available for export by some 40%.
In 2007, exports were limited to 40 000 tonnes. A fall of 33%!
In 2009, 30 000 tonnes.
And the cuts should be more drastic in 2010!
In its 2009-2015 plan for the development of rare earth elements, Beijing wants to ban exports of dysprosium, terbium, thulium, lutetium and yttrium. Exports of other rare earth elements being strictly fixed to 35 000 tonnes maximum per year.
And I don't even speak about the taxes up to 25% on some rare earth metals.
In June 2010, China has new objectives:
- To close all the illegal mines and thus to remove illegal exports
- To put the extraction in hands of 3 to 5 large public companies.
- To unify the supply chain of rare earth metal.
So China will make the price and will control 100% of the market.
The rare earth metals world demand doubled over the seven last years and should still double from now to 2013.
Some even say that it could increase by 50% per year from 2010 to 2015!
--> So Rare earth production is or may soon be too low to keep up with growing demand, and rare earth metals prices may increase.
The rare earth metals are very important for the development of industries of high technologies, of defense, and all “green” technologies.
US policy makers should consider all options, including government incentives if necessary, to return US supply back to the point that it can satisfy at least US national defense requirements (Mountain Pass mines).
The United States started to redevelop its rare earth metals mine.
They have to be patient, to create, develop and put in production a mine can take 8-10 years.
But the operation will be very profitable.
It should also be noted that Canada also has large and high grade deposits under development.
Follow the investment opportunities in cobalt, vanadium and lithium.
Dacha Capital [TSX.V:DAC, OTCQX:DCHAF] is a relative newcomer to the rare earths sector.
Global X Lithium, an Lithium ETF.
Invest in ETF based on rare metals
Article
The emergence of a mining sector with high potential investment opportunities:
Strategic and irreplaceable.
Without rare earth metals, no hybrid cars, no iPhone, no Ipad, no LCD or Plasma screen, no solar technology, no lamps with low consumption LED. No national defense either (they are essential in the armament) and no effective oil refining.
Moreover 25% of the future new technologies will need the rare earth metals.
The rare earths are between the hands of Beijing.
China produces 95% of the world production of the highly strategic and irreplaceable rare earth metals.
China’s Monopoly Over Rare Earth Element
Over the last seven years, China has reduced the amount of rare earths available for export by some 40%.
In 2007, exports were limited to 40 000 tonnes. A fall of 33%!
In 2009, 30 000 tonnes.
And the cuts should be more drastic in 2010!
In its 2009-2015 plan for the development of rare earth elements, Beijing wants to ban exports of dysprosium, terbium, thulium, lutetium and yttrium. Exports of other rare earth elements being strictly fixed to 35 000 tonnes maximum per year.
And I don't even speak about the taxes up to 25% on some rare earth metals.
In June 2010, China has new objectives:
- To close all the illegal mines and thus to remove illegal exports
- To put the extraction in hands of 3 to 5 large public companies.
- To unify the supply chain of rare earth metal.
So China will make the price and will control 100% of the market.
The rare earth metals world demand doubled over the seven last years and should still double from now to 2013.
Some even say that it could increase by 50% per year from 2010 to 2015!
--> So Rare earth production is or may soon be too low to keep up with growing demand, and rare earth metals prices may increase.
The rare earth metals are very important for the development of industries of high technologies, of defense, and all “green” technologies.
US policy makers should consider all options, including government incentives if necessary, to return US supply back to the point that it can satisfy at least US national defense requirements (Mountain Pass mines).
The United States started to redevelop its rare earth metals mine.
They have to be patient, to create, develop and put in production a mine can take 8-10 years.
But the operation will be very profitable.
It should also be noted that Canada also has large and high grade deposits under development.
Follow the investment opportunities in cobalt, vanadium and lithium.
Dacha Capital [TSX.V:DAC, OTCQX:DCHAF] is a relative newcomer to the rare earths sector.
Global X Lithium, an Lithium ETF.
Invest in ETF based on rare metals
Article
EUR/USD USD/JPY GBP/USD
EUR/USD:
EURUSD has continued to push higher after confirming a Head and Shoulders bullish reversal chart formation, with prices now testing resistance at 1.3266, the 76.4% Fibonacci retracement of the 4/12-6/7 downswing as well as the upside target implied by measuring the distance between the head and neckline of the H&S formation. We can look below the bottom of a rising channel established from late June (now at 1.3128) to position for a selling opportunity.
USD/JPY: Japanese Yen Breaks 2009 High
Daily Bars
8480 (2009 low) has been broken and focus is now on the all time low just below 80 (1995 low). Former supports, 8520 and 8560, are now resistance. A move above 8625 would begin to suggest that an important low is in place.
GBP/USD: Bulls Clear Key Resistance, Challenge 1.60
Strategy: flat
GBPUSD has cleared the top of a rising channel set from the lows in May as well as the horizontal barrier at 1.5831, with prices now stalling ahead of the psychologically significant resistance at the 1.60 figure. A push above this boundary would open the door for a challenge of 1.6377.
Source: Dailyfx
Wednesday, August 4, 2010
China agricultural sector
New green revolution: China is now able to produce enough food for its 1.4 billion people
So follow the Chinese agricultural firms, there should be interesting investment opportunities...
Tuesday, August 3, 2010
EUR/USD
(240 minutes bars)
The EURUSD has slightly exceeded the 38.2% retracement of the decline from 1,5144 and is now testing the March low of 1,3270. Since price has exceeded 1,3250, the previously preferred count is no longer. The alternate, in which the rally from the low is a complex double three (2 zigzags), is now preferred. The 2 zigzags would be equal at 1,3420 but we could get a top before then as RSI is overbought and divergent on multiple time frames.
US Dollar Index
Prices have taken out support at 82.11, the 76.4% Fibonacci retracement of the 4/12-6/7 upswing. Still, positive RSI divergence continues to hint that a rebound is in the works in the near term, albeit from a lower base. Continued selling is eyeing a move toward April’s swing low at 80.07.
Crude Oil
The bullstook out resistance June’s swing high ($79.38), with prices now set to challenge the upper boundary of a rising channel set from May, now at $82.21. A push above that will expose the 2010 top at $86.84.
Gold
Prices are re-testing support-turned-resistance at a rising trend line established from the low in February, with a break higher exposing the top of a falling channel established from the swing high in June (now at $1199.43). However, a Shooting Star candlestick setup hints a move lower may be in the cards from here, with initial support at the $1170.00 figure.
Source: Dailyfx.com
Coffee, what else?
The coffee price increased by 40% in just one year (reaching its highest level in 12 years), and went up by 29% in 15 days.
The arabica is a high quality coffee collected in Central America, East Africa and in Brazil (larger producer in the world of arabica).
The robusta is collected mainly in Asia and in Africa. The largest producer is Vietnam. This coffee is mainly used to make instant coffee.
American stocks decreased by 28% this year, whereas they reached 2,2 million bags last year.
However stocks could fall to 1,74 million bags in September and to 800 000 in March, according to experts.
The official stock of the LIFFE (robusta) passed in one year from 400 000 to 230 000 tonnes.
Why?
Because the two last harvests of arabica in Central America and Colombia (the second largest producer of arabica after Brazil) were bad, and last year the production of Brazil was damaged by excess rain. For the robusta, dryness hit Asia this year and Vietnam should produce 17,5 million tonnes this year vs. 18 million last year.
So the supply will decrease by 6% from 128 million tonnes last year to 120,6 this year, while the demand for arabica and robusta remain constant.
To sum up:
- Insufficient Supply for a constant demand
- Level of coffee stocks to low
- Fears of “coffee shortage” on the market
-->It explain why the coffee price is going up.
Also there is many hedge funds which speculates in the coffee market. These funds shorted massively the coffee, when an important actor of the market decided to ask for the physical delivery of all the July expiring contracts. Due to the supply shortage they were forced to repurchase their short positions at a high price to respect their engagements.
In a short-term coffee will be under 150 with 50/61,8% of Fibonacci retracements, with a support at 145 and 135 if it breaks the 145.
However coffee should be bullish again soon and reach the 175.
Follow Coffee Stocks
Arabica Coffee (KC, ICE [NYBOT]) in cents/pound
The arabica is a high quality coffee collected in Central America, East Africa and in Brazil (larger producer in the world of arabica).
The robusta is collected mainly in Asia and in Africa. The largest producer is Vietnam. This coffee is mainly used to make instant coffee.
American stocks decreased by 28% this year, whereas they reached 2,2 million bags last year.
However stocks could fall to 1,74 million bags in September and to 800 000 in March, according to experts.
The official stock of the LIFFE (robusta) passed in one year from 400 000 to 230 000 tonnes.
Why?
Because the two last harvests of arabica in Central America and Colombia (the second largest producer of arabica after Brazil) were bad, and last year the production of Brazil was damaged by excess rain. For the robusta, dryness hit Asia this year and Vietnam should produce 17,5 million tonnes this year vs. 18 million last year.
So the supply will decrease by 6% from 128 million tonnes last year to 120,6 this year, while the demand for arabica and robusta remain constant.
To sum up:
- Insufficient Supply for a constant demand
- Level of coffee stocks to low
- Fears of “coffee shortage” on the market
-->It explain why the coffee price is going up.
Also there is many hedge funds which speculates in the coffee market. These funds shorted massively the coffee, when an important actor of the market decided to ask for the physical delivery of all the July expiring contracts. Due to the supply shortage they were forced to repurchase their short positions at a high price to respect their engagements.
In a short-term coffee will be under 150 with 50/61,8% of Fibonacci retracements, with a support at 145 and 135 if it breaks the 145.
However coffee should be bullish again soon and reach the 175.
Follow Coffee Stocks
Money supply and Inflation
Source: Wikipedia.org
M1: The total of all physical currency part of bank reserves + the amount in demand accounts ("checking" or "current" accounts).
M2: M1 + most savings accounts, money market accounts, retail money market mutual funds,and small denomination time deposits (certificates of deposit of under $100,000). (A key economic indicator of inflation.)
M3: M2 + all other Certificate of deposit (CDs) (large time deposits, institutional money market mutual fund balances), deposits of euro-dollars and repurchase agreements.
Source: Inflationdata.com
Following the theory of the Austrian economists who measure the inflation by calculating the growth of what they call 'the true money supply', how many new units of money that are available for immediate use in exchange, that have been created over time.
This interpretation of inflation implies that, within a centralized banking system, inflation is always a distinct action taken by the central government or its central bank, which permits or allows an increase in the money supp, including bank credit as a contributor to inflation.
In the US, the value of bank credit generated by private financial institutions and held within checking accounts currently rivals the value of the bills and coins "printed" by the Federal government, and has, at times, significantly exceeded the value of printed money. In addition to state-induced monetary expansion, the Austrian School also maintains that the effects of increasing the money supply are magnified by the credit expansion usually performed by private financial institutions as a result of the fractional-reserve banking system permitted in most economic and financial systems in the world.
Austrian School economists claim that the state uses inflation as one of the three means by which it can fund its activities. In other cases, the central bank may try avoid or defer the widespread bankruptcies and insolvencies which cause economic recessions or depressions by artificially trying to stimulate the economy through encouraging money supply growth and further borrowing via artificially low interest rates.
“In the absence of the gold standard, there is no way to protect savings from confiscation through inflation. There is no safe store of value. If there were, the government would have to make its holding illegal, as was done in the case of gold. If everyone decided, for example, to convert all his bank deposits to silver or copper or any other good, and thereafter declined to accept checks as payment for goods, bank deposits would lose their purchasing power and government-created bank credit would be worthless as a claim on goods. The financial policy of the welfare state requires that there be no way for the owners of wealth to protect themselves.
This is the shabby secret of the welfare statists' tirades against gold. Deficit spending is simply a scheme for the confiscation of wealth. Gold stands in the way of this insidious process. It stands as a protector of property rights. If one grasps this, one has no difficulty in understanding the statists' antagonism toward the gold standard.”
"It is well that the people of the nation do not understand our banking and monetary system, for if they did, I believe there would be a revolution before tomorrow morning."
Henry Ford
Henry Ford
The devaluation of the Dollar:
Source: Oustanding Investment
This figure shows that the money supply skyrocketed while the dollar value plunged by 96% thus plummeting the purchasing power.
In 1971 you could buy a house for $50,000 then and, just on an inflation basis, it would be worth $350,000 today, and back then, you could retire on $270,000 in savings and it would be as good today as being a millionaire.
The enemy of the Fed is a dead and stagnant economy, the deflation, an economy in which nothing moves and nobody buys a thing.
Therefore the Fed secretly fights to hold it off desperately every single day, by flooding the market with cash and easy credit. Because regular cash and credit injections make everyone feel rich.
The theory goes, when you've got cash and low-priced credit, companies borrow and expand. Consumers borrow and spend. Families borrow and buy homes.
Note that now we are exporting some of our inflation to China as they send us goods and buy our debt.
The Fed Chairman Ben Bernanke famously said in a speech at the National Economists Club in Washington, in November 2002:
“Like gold, U.S. dollars have value only to the extent that they are strictly limited in supply. But the U.S. government has a technology called a printing press (or, today, its electronic equivalent) that allows it to produce as many U.S. dollars as it wishes at essentially no cost... We conclude that under a paper money system, a determined government can always generate higher spending and, hence, positive inflation.”
In other words, if you want to juice an economy... turn on the printing presses and make it as easy as all get-out to borrow money at a low, low rate of interest.
And Ludwig von Mises, the famous economist said:
“There is no means of avoiding the final collapse of a boom brought about by credit expansion. The alternative is only whether the crisis should come sooner as a result of the voluntary abandonment of further credit expansion, or later as a final and total catastrophe of the currency system involved.”
The Bush administration, with full knowledge of the implications of a credit disaster, borrowed more money from 2000–2008 than every White House since the time of Washington!
“Economists agree this can’t go on. We can borrow and borrow, but eventually there will be a day of reckoning”
Joseph Stiglitz, former white house economist
The dollar's worth today is just pennies compared with what it bought a century ago.
In fact, its worth is just a fraction now, as we just demonstrated, the money supply had gotten so embarrassing that the Fed actually "retired" a number, "M3," which was the most broad-reaching measure of how much cash floats around in the system.The dollar's worth today is just pennies compared with what it bought a century ago.
Subscribe to:
Posts (Atom)
