We can notice that there is a high correlation between the evolution of the Chinese equity market and the commodity market.
Of course you would say that it's logic;
a low economic growth rate = ↓ in China's commodity imports = ↓ commos prices
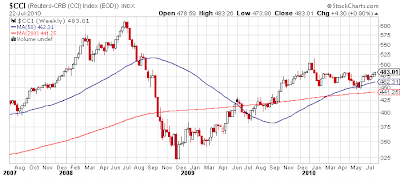
Let's see these two charts:
CRB Index
*The Thomson Reuters/Jefferies CRB Index is a commodity index made up of 19 commodities as quoted on the NYMEX, CBOT, LME, CME and COMEX exchanges.
Shangai Stock Exchange Composite Index
Now let's superimpose them:
So the evolution of the Shangai Composite Index can tell us what the CRB Index will do in the next months.
There is a positive correlation of 72%! and even 80% with crude oil.
One good example:
The Chinese equity index was one of the first index to go down at the end of 2007, and it was then followed by the commodity index at the beginning of summer 2008 well before Lehman Brothers bankruptcy and other equity indexes.
Even if the last trend of the Shangai Composite Index are not highly correlated to the CRB Index, knowing that China is the world's biggest importer/consumer of all major commodity categories, I advise you to follow this Index in order to change you portfolio strategy.
Another useful tool is the relationship between CRB Index and the Dow Jones Industrial Average Index, but that's another story...


No comments:
Post a Comment