(Click to enlarge)
On the above weekly chart, Gold Stocks remain in an
overall downtrend. As you can see on the chart, the GDX continues to
have trouble at the resistance zone. Longer term support remains down at
the 40 level with continued resistance at the neckline. With 7 touches
on trendline, this remains a formidable resistance area.
The 3-year chart for gold reveals that it now has the
capacity to make great gains rising off the Triple Bottom of the lows
of last September, December and the low of recent weeks. If last week's
summit had produced little like its predecessors, then gold would have
crashed its lows and plunged, but the summit ended with a "sea change"
as Angela Merkel of Germany finally realized that if Germany didn't
concede it would go down with the ship.
We can see that we now have an excellent risk/reward ratio for
going long gold.
(Click to enlarge)
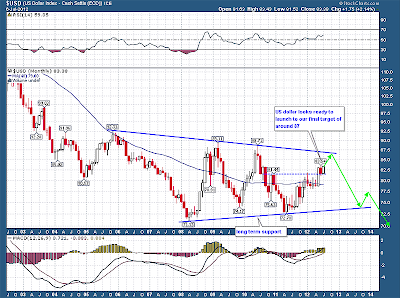
The USD has been on fire for
the last year. Unless something comes out of the ECB here soon to
defend the EURO, our target on the USD remains 87-88. We expect a major
top around that level. Should the dollar continue to rally, expect
more pressure on commodities and gold to fall to lower levels.


No comments:
Post a Comment