Saturday, September 22, 2012

Gold Analysis - Sept 12

 
In blue central banks holdings, and in yellow gold spot price.


Russia aims to increase its official gold reserves to 3000 tons (against 918 tonnes today).  
China, meanwhile, has claimed it will raise its gold holdings to 4,000 tons of gold (against 1054 currently).


US Quantitative Easing vs. Gold price
 

Graphique du ratio indice minières/cours de l'or

Gold mining companies / gold price ratio

Le cours des minières (en rouge) rattrapent son retard sur le cours de l'or (en bleu)

Gold mining companies (in red) are coming back close to gold price.


Graphique de l'historique et l'estimation du PER sur l'or

We still have a low P/E ratio on Gold.

Saisonnalité de l'or calculée sur plus de trente ans
Time to invest in gold.


Graphique du cours de l'or

A pull-back is coming soon, then we will break the $1,800 resistance and  reach the $1,900-$2,000 zone.

Graphique du GDX

Back to the $48, it will be a good opportunity  to invest in Gold mining companies.


Graphique de l'indicateur de sentiment sur l'or

Bull market ! Not yet 80...(overbought) (under 30 -> oversold)

Monday, July 9, 2012

Technical Analysis of Gold and Dollar Index

 (Click to enlarge)
 On the above weekly chart, Gold Stocks remain in an overall downtrend. As you can see on the chart, the GDX continues to have trouble at the resistance zone. Longer term support remains down at the 40 level with continued resistance at the neckline. With 7 touches on trendline, this remains a formidable resistance area.


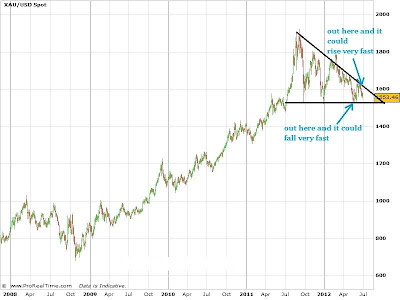
 The 3-year chart for gold reveals that it now has the capacity to make great gains rising off the Triple Bottom of the lows of last September, December and the low of recent weeks. If last week's summit had produced little like its predecessors, then gold would have crashed its lows and plunged, but the summit ended with a "sea change" as Angela Merkel of Germany finally realized that if Germany didn't concede it would go down with the ship. 
We can see that we now have an excellent risk/reward ratio for going long gold.

 (Click to enlarge)
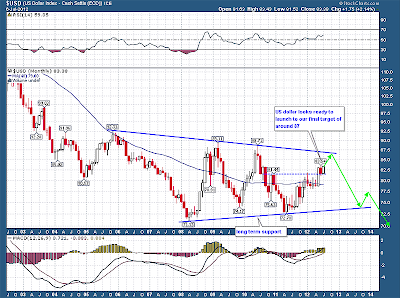
The USD has been on fire for the last year. Unless something comes out of the ECB here soon to defend the EURO, our target on the USD remains 87-88. We expect a major top around that level. Should the dollar continue to rally, expect more pressure on commodities and gold to fall to lower levels. 

Gold July Triangle

(Click to enlarge)

HUI - Gold Bugs Index

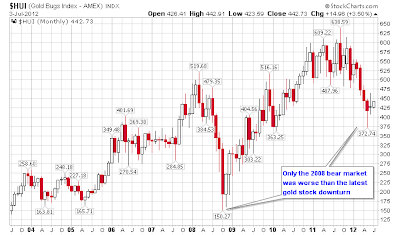
It's been a rough time recently for gold and gold stock investors. The last nine months has been the second worst cyclical downturn in gold and gold stocks during this long term secular bull market for gold. This chart shows how brutal this recent correction has been:

(Click to enlarge)

This bear market was not only the second worst in percentage loss, but also the second longest in time duration:


After closing the year at 573 in 2010, the HUI Gold Bugs Index made 4 attempts during 2011 to takeout the 600 level, and all 4 attempts failed. The next chart shows the HUI's performance since 2003:


Gold meanwhile gained more than 11% in 2011, and muddled through the first half of 2012 with a small gain :


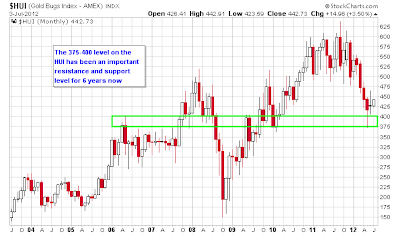
After making a bottom in the middle of May, there are encouraging signs this gold bear market has run its course. First the recent successful test of the 375 level on the HUI that was rejected for higher prices was a logical long term support level. The 375-400 level was major resistance for 2006-2007, then became support briefly in 2008 before the financial crisis hit. Then in 2009 that level was brief resistance again before the HUI broke above it in late 2009, then tested that level as support in early 2010 and didn't look back after that. Now that this 2012 correction has once again retested that level and soundly rejected it (at least so far) it could prove to be the final test for that level for this bull market.


 (Click to enlarge)

--> It appears as if the gold sector is gradually coming to the end of the recent bear market, given the technical evidence and severely bearish sentiment. A top in paper assets (the dollar and bonds) would probably be the final nail in the coffin for this gold correction.

Sunday, May 13, 2012

Recycling of precious metals is not too bad!...

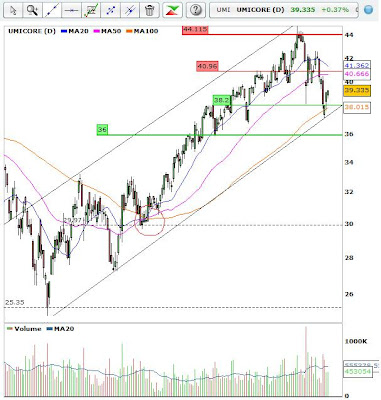
Umicore : http://en.wikipedia.org/wiki/Umicore
Euronext : UMI


(Click to enlarge)

JPM : London whale - CDS Loss $2 billion

Article : http://uk.reuters.com/article/2012/05/11/uk-jpmorgan-trading-idUKBRE8491I320120511

Mr. Dimon: "He said it wasn't clear whether the bank had broken any laws or violated any rules. "We've had audit, legal, risk, compliance, some of our best people looking at all of that."

In a conference call disclosing the problem on Thursday, Dimon said the $2 billion in losses could rise by a further $1 billion, and acknowledged they were linked to a London-based credit trader Bruno Iksil. Nicknamed the 'London Whale', Iksil amassed an outsized position which hedge funds bet against, according to a report in The Wall Street Journal in April.


The exact nature of the trading loss is still unclear, although sources said a host of asset managers, arbitrageurs and hedge funds were on the other side of the bet, viewing it as good value and a effective way to insure portions of their portfolio.

Blue Mountain, a hedge fund with offices in New York and London, was among those on the other side of JPMorgan's trade, according to two people familiar with the situation.
 
The Democrat co-authored the 2010 Dodd-Frank financial reform law designed to avoid a repeat of the recent credit crisis.

=>  We need to regulate the CDS market, trade them when we have a real exposure to the underlying asset.