Monday, December 12, 2011

DJIA Technical Analysis 12/12/11

(Click to enlarge)
  • Bullish SAR, MACD over the signal line, williamR is overbought and the rsi index is neutral.
    • For the bullish the resistance will be close to 11230pts, and then 12480pts.
    • For the bearish the resistance will be ma20 at 11885pts and then the bullish sar close to 11755pts.

    Sunday, November 20, 2011

    World Gold Council new issue of gold demand trends - Q3 2011


    Silver, GBPUSD, EURGBP

    Where is going Silver, consolidation? here is the death cross with MA50 passing under MA200.
    But investment demand is increasing as supply increase.


    GBP/USD - A 8,3% Unemployment rate (highest since 1994) is killing the pound sterling.

      But EUR/GBP still going down...

    Us Index Technical Analysis - Nov 21

     The S&P 500, as represented by the S&P 500 SPDRS (NYSE:SPY) ETF, pulled back towards its October breakout level near $121 after failing to clear its 200-day moving average. It also dropped under its 20-day moving average in the process, and is now pulling back towards its 50-day moving average. While the exact moving average values are usually unimportant, the areas are a good measuring stick to a stock's character. SPY remains in a neutral zone here, but any more near-term weakness would likely spur on more selling pressure.


    The Diamonds Trust, Series 1 (NYSE:DIA) ETF also ended up slipping back under its 200-day moving average this week. It is close to testing its October breakout area near $116, and this level has held as support on a few occasions. Much like SPY, DIA remains in a consolidation after a furious preceding rally and some profit taking is not surprising. However, DIA is at a critical area as well, and any sustained weakness under $116 may lead to increased selling pressure.

     After holding above the $56 level for weeks, The Nasdaq 100, as represented the Powershares QQQ ETF (Nasdaq:QQQ) ETF, finally cracked this week. The move may be a little disconcerting for bulls, as QQQ is now acting as the weakest index, despite being the clear leader over the preceding few months. QQQ is now below prior support and its 50- and 200-day moving averages. There is some gap support and a prior low near $54 that may bring in buyers, but overall the action in QQQ doesn't bode well for market bulls.


    One slight positive is that the small caps, as represented by the iShares Russell 2000 Index (NYSE:IWM) ETF, are not moving lower in unison with QQQ. IWM more closely resembles SPY or DIA in that it dropped down towards its breakout level near $71. IWM’s 50-day moving average looms just under this area and could help provide support for the ETF. 


    The Bottom Line
    The week’s action was a little surprising considering some of the underlying strength that has been developing in individual names. However, despite the weakness, the general markets remain in a consolidation with even QQQ not really qualifying as a breakdown yet. 
    However, bulls will have to step up soon if they want to push these markets higher. While a shakeout under the support levels referenced above can not be ruled out, any sustained weakness under these levels would be a clear sign that the markets remain vulnerable to steeper declines.
    Volatility has remained high since August and doesn't appear ready to die down just yet...

    Thursday, April 21, 2011

    Gold Portfolio mgt +35.33%

    (click to enlarge)

    Portfolio Performance vs. S&P500 :
    (click to enlarge)

    Gold & Silver hit new record highs

    Gold:

    (1 Year Gold London Fix PM Daily with 14 and 200-day moving averages)
    (click to enlarge)

    -->    Gold hits a new record high at $1,504.75 per troy ounce on thursday 04/21/2011

    (we forecasted this price in our 2010 gold survey :-), see at the right hand of the blog)

    Are we going to $1,600/oz ?

    Silver:

    (1 Year Silver London Fix Daily with 14 and 200-day moving averages)

     -->    Silver hits a new record high at $46,58 per oz ounce on thursday 04/21/2011


    Goldman Sachs three and six-month gold price forecasts were $1,525 an ounce, we are very close to it now ! ( "low U.S. real interest rate environment and the return of quantitative easing which will likely be a strong catalyst to drive gold prices higher")


    Gold/Silver ratio:

                                          (1 year Gold/Silver ratio)


    "Gold still represents the ultimate form of payment in the world."
    Alan Greenspan Testimony before US House Banking Committee May 1999.         


    "It is well that the people of the nation do not understand our banking and monetary system, for if they did, I believe there would be a revolution before tomorrow morning."
    Henry Ford


    Gold Portfolio April +48.6%

    (click to enlarge)

    Yellow Metal TA

     
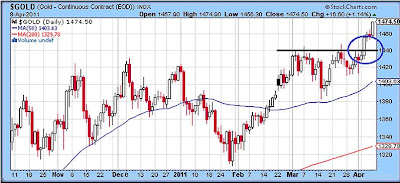
    --> Last week the price of gold made another record high hitting $1475 an ounce.
     The break above $1440 an ounce indicates that the price of gold could be targeting $1480 and then $1500 an ounce.                                     

    Fears of rampant inflation, further weakening of the dollar, the Eurozone debt crisis and general uncertainty around the world all helped push the price of gold to a record high last week.
    On Friday the gold market ended on a high note a new fresh all time high of $1475 an ounce.

    Last week in an event that has gone practically unnoticed, billionaire, George Soros organized a major economic conference with the purpose of discussing ways to "establish new international rules" and "reform the currency system." The event sponsored and funded to the tune of some $50 million by Soros' Institute for New Economic Thinking (INET), brought together more than 200 academic, business and government policy leaders.

    The four-day conference which began on Friday April 08 took place at the Omni Mount Washington Resort, Bretton Woods, New Hampshire. The hotel was the scene of a historic conference in 1944 that laid the groundwork for the International Monetary Fund and the World Bank.

    According to Soros, the current international monetary system cannot survive in its present form. Soros argues that it could and should be revamped so that American leadership would be "re-established…in a more acceptable form." It should also "engage the larger European Union, as well as the emerging economies of Eastern Europe, Latin America, and Asia."

    The list of famous attendees included ex-Fed Chairman Paul Volcker, former British Prime Minister Gordon Brown and World Bank executive and Nobel Prize winner in economics Joseph Stiglitz.

    (In 1999 the then UK Chancellor of the Exchequer, Gordon Brown decided to sell off more than half of the country's centuries-old gold reserves. The decision to sell the gold is now regarded as one of the Treasury's worst financial mistakes and has cost taxpayers almost £14 billion.)

    Just to remember George Soros acquired 5 million shares in the iShares Gold Trust valued at $64 million for its fund.


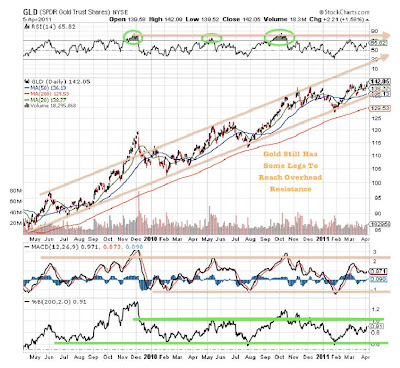
    Are we going to break this triangle by the top ?


    GLD SPDR ETF:


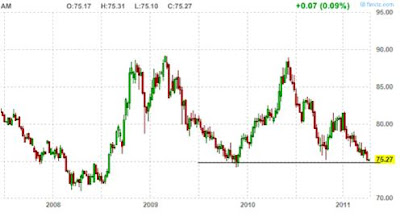
    USDX Index:

    --> The US Dollar Index is falling to its 2009 low.


    Touradji Capital Management


    The Iranian-born Touradji's $3.5 billion assets under management make his commodity-based hedge fund the biggest in the U.S.

    He is said to have a hot temper (former employees have sued over back pay and abusive behavior, claims he denies), but his trading is unusually disciplined in a volatile market.

    Since starting his fund in 2005 he's never had a down year, including 2008, when he returned 13%. So far he's up 5.7% in 2009. (He was ranked 18th Wall Street highest earners in 2009 wih $110M by Forbes)

    Mentor: Julian Robertson of Tiger Management. Touradji wanted to work in the oil industry, but the hedge fund icon put him in commodities -- and he was hooked.
     
    --> Paul Touradji invested 80% of the equity portion of his commodities-focused hedge fund’s portfolio into gold !

    Welcome to Citadel :-)

    Gold fundamental & Technical

    (click to enlarge)