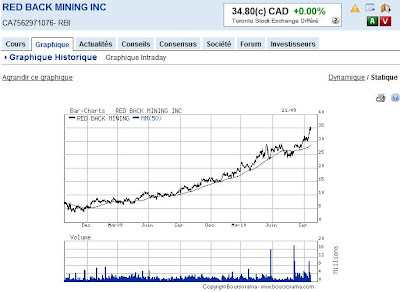
Red Back Mining, a newcomer in the Gold industry:
Sunday, September 26, 2010
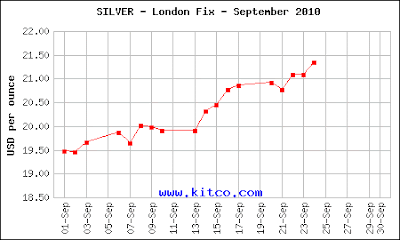
Why Silver still going up?
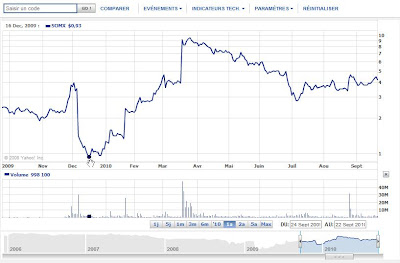
September Silver price Chart
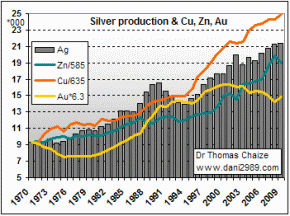
Silver production is highly correlated to gold, copper, and zinc production (few mines extract only silver)
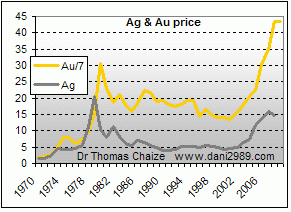
A positive correlation between Au and Ag price.
Half of the total demand for Silver is industrial demand, the other half is jewellery and investment demand.
So silver price is just following gold, copper and zinc bull trend.
Google an indicator of market trend?
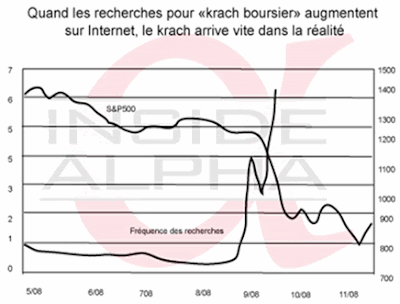
As you can see requests for "stock market crash" on google were exploding just before the 2008 crash starts.
So google statistics can be a useful tool to indicate investors fear and predict a stock market crash.
So google statistics can be a useful tool to indicate investors fear and predict a stock market crash.
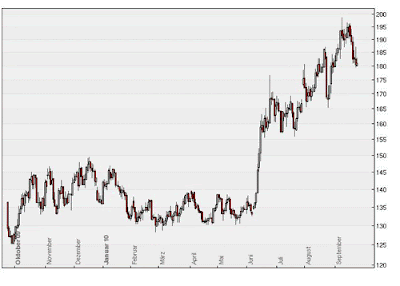
Arabica coffee +90% since march 2009 low
KC, ICE [NYBOT]
198c is a major resistance level, and analysts say that arabica already reached its highest, so it's time to take your profits.
Tuesday, September 14, 2010
Overview of the week
Source: StockCharts.com
The Diamonds Trust, Series 1 (NYSE:DIA) ETF, which tracks the Dow Jones Industrial Average, respected a support level earlier this week and ended up surging from those lows. The $100 level has become a clear level to watch, as bulls have aggressively defended it on a few occasions. Looking above, DIA is testing an important level near $105, which is the lower end of a bearish gap. The close above the nearby 200-day moving average suggests that the rally could last much longer than some are anticipating and reduces the probability of a double dip. Friday's close above this level could lead to a test of the more important level of $107.
Source: StockCharts.com
The Powershares QQQ ETF (Nasdaq:QQQQ) pushed higher and remained above its 200-day moving average for the second consecutive week. Many traders will now set their sights on the August high of $47.19. The sharp rebound over the past few weeks may have trapped some bears and it should add to the upward pressure moving forward. If QQQQ breaks above the high, it could lead to a longer term trend higher.
eur/usd
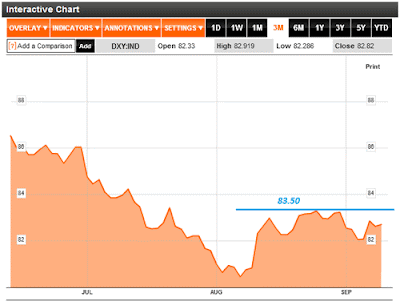
US Dollar Index (USDX) (source:Bloomberg)
EUR/USD
The key resistance is 1.2775 (red line) if its breaks the next target will be 1.2880 and then 1.30 (Fibonacci).
Fear of a double-dip w?
Gold reach its highest price of last june $1262/oz
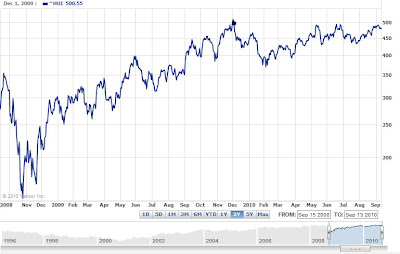
Amex Gold Bugs Index (HUI) evolution since nov 2009
USD/JPY hits new 15-year low (83.23 yen)
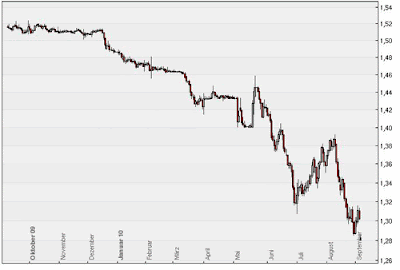
EUR/CHF hits a new record of 1.28 for 1€
Investors invested massively in the German Bund last August
fear of a double-dip w? investors are looking for safety investments these days!
Tin price still going up
A high demand (+20% compare to jan-april 09, mostly for electronics industry) which can not reach the offer.
Indonesia (Timah and Koba Tin), Peru, China, and Bolivia which (the largest producers of tin) are reducing their exports due to production difficulties (extraction cost, government policy...).
Next resistance level for tin will be $22,000, if it breaks the next target price will be $23,000.
Subscribe to:
Comments (Atom)
